_edited.png)
Inventory Management KPIs: A Practical Guide for Operators

Most inventory management KPI advice starts with the wrong prescription: track everything. A warehouse dashboard can carry dozens of ratios, but a vending route needs a short list that tells a driver or route lead what to do before a customer finds an empty slot. More data doesn't automatically create better decisions. It often buries the signal.
For operators trying to win more break room vending contracts, the connection is direct. A dependable machine, accurate replenishment, and visible service history make a stronger sales story than a spreadsheet full of disconnected metrics. Local search visibility matters too. Businesses appearing in Google's Local Pack have been reported to receive 126% more traffic than businesses outside the top three local positions, according to Vendmoore's industry best-practices resource. The right scorecard helps you deliver the operational experience that turns that visibility into enquiries.
Why Most KPI Lists Fail Smart Vending Operators
The common mistake is treating every vending machine like a warehouse bin. Operators then add stock-to-sales ratios, carrying-cost calculations, supplier measures, order-cycle metrics, and dozens of other fields until the dashboard becomes a reporting exercise instead of a control system.
Drivers don't act on thirty disconnected indicators. Route supervisors stop checking dashboards that require too much interpretation, while genuine warnings, such as a fast-selling drink approaching an empty slot, sit beside harmless fluctuations in slow-moving snacks. The result is predictable: the team has more information but less attention.
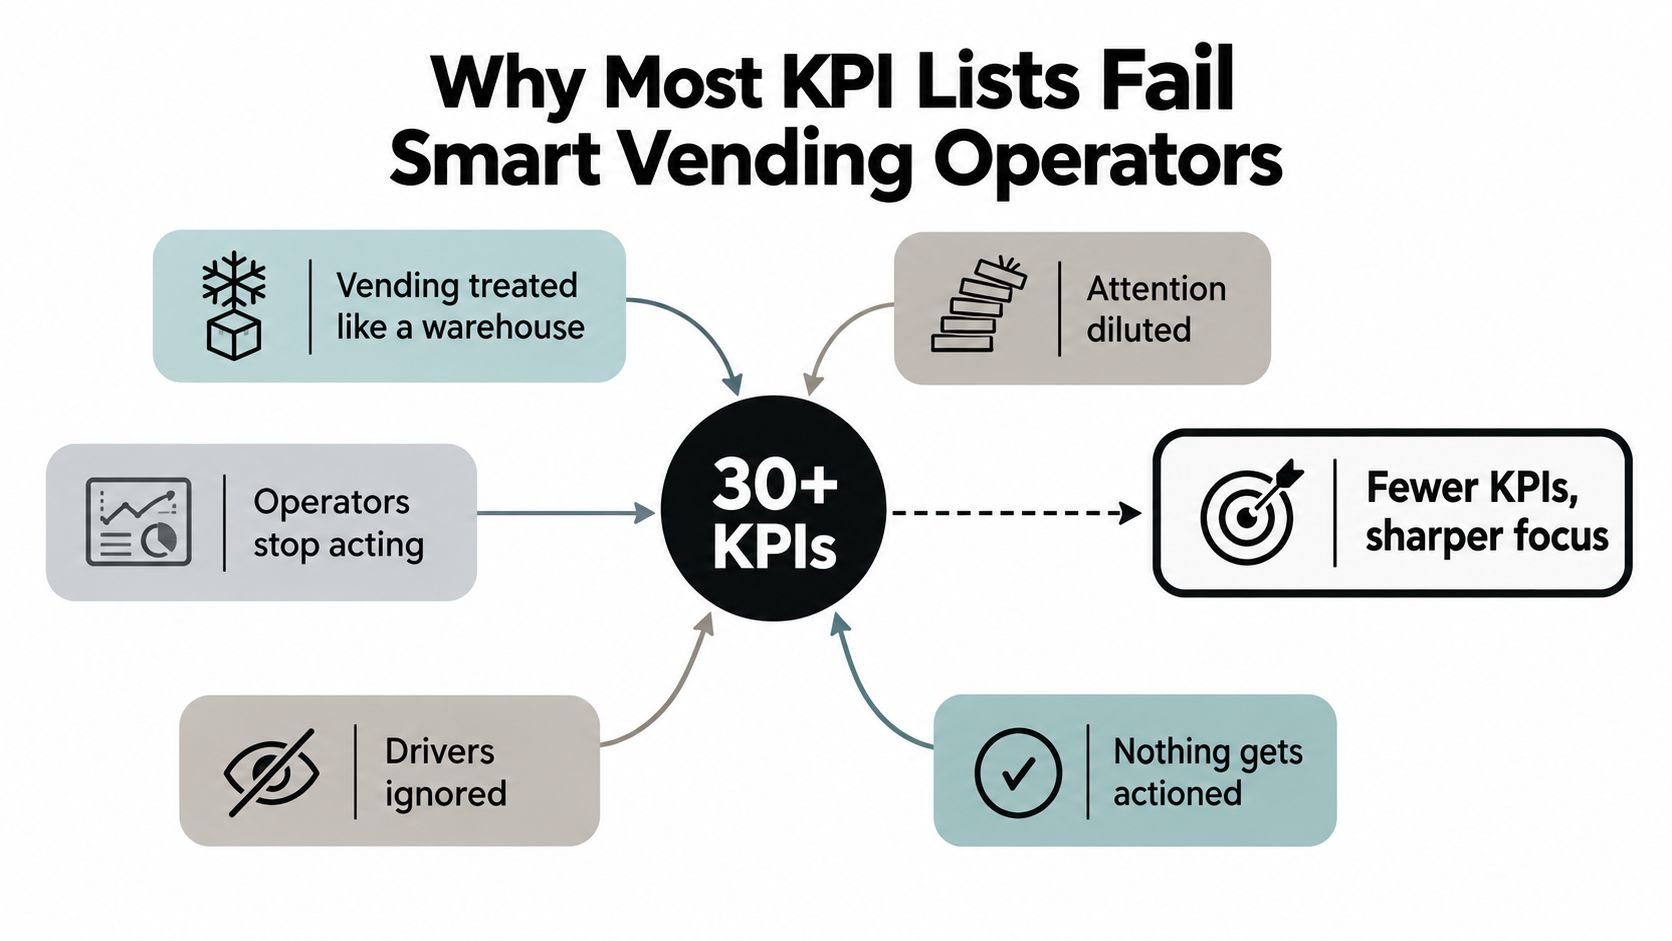
A practical scorecard begins with five to seven inventory management KPIs, not a catalogue. It should combine:
Service: stockout rate or fill rate, showing whether customers find what they want.
Speed: inventory turnover or days on hand, showing whether stock is moving at a useful pace.
Accuracy: inventory record accuracy, showing whether the system can be trusted.
Cost: shrinkage and spoilage, showing what inventory is costing beyond its purchase price.
These measures work as a group. A low stockout rate means little if the operator is overfilling machines with products that expire. A high turnover figure can also be misleading if inaccurate counts make the denominator look smaller than the physical stock position.
Practical rule: every KPI needs a named owner and a predefined action. If nobody knows what to change when the number moves, it isn't helping the route.
Teams looking to improve the underlying process can also review guidance on better inventory systems, particularly where counting, replenishment, and system discipline intersect. For the vending operator, the useful question isn't which formula appears in the longest article. It's which small set of measures predicts an empty machine early enough to prevent it. Vendmoore's explanation of why inventory management is important provides additional operational context for that decision.
The Four Categories of Inventory Management KPIs
A balanced scorecard sorts metrics into service, speed, accuracy, and cost. This prevents a strong result in one area from hiding a failure somewhere else.
Service measures the customer-facing outcome. Stockout rate records unavailable demand, while fill rate shows how completely a replenishment visit restored expected stock. Together, they distinguish a machine that is unavailable between visits from a route that arrives but doesn't load the right quantities.
Speed measures how product and cash move through the operation. Inventory turnover shows how often average inventory is sold and replaced, while days on hand translates that movement into a practical stock-duration view. A machine can have healthy service but weak speed if it stays full of slow sellers.
Accuracy answers a more fundamental question: can the operator trust the system record? Inventory record accuracy compares book stock with physical stock. Count variance, scan integrity, and cycle-count compliance help explain why a dashboard may claim a product is available when a customer sees an empty spiral.
Cost measures the losses created by holding and handling products. Shrinkage covers unexplained loss, miscounts, theft, and machine-related discrepancies. Spoilage covers expired, damaged, or out-of-temperature products. Keeping them separate matters because each requires a different fix.
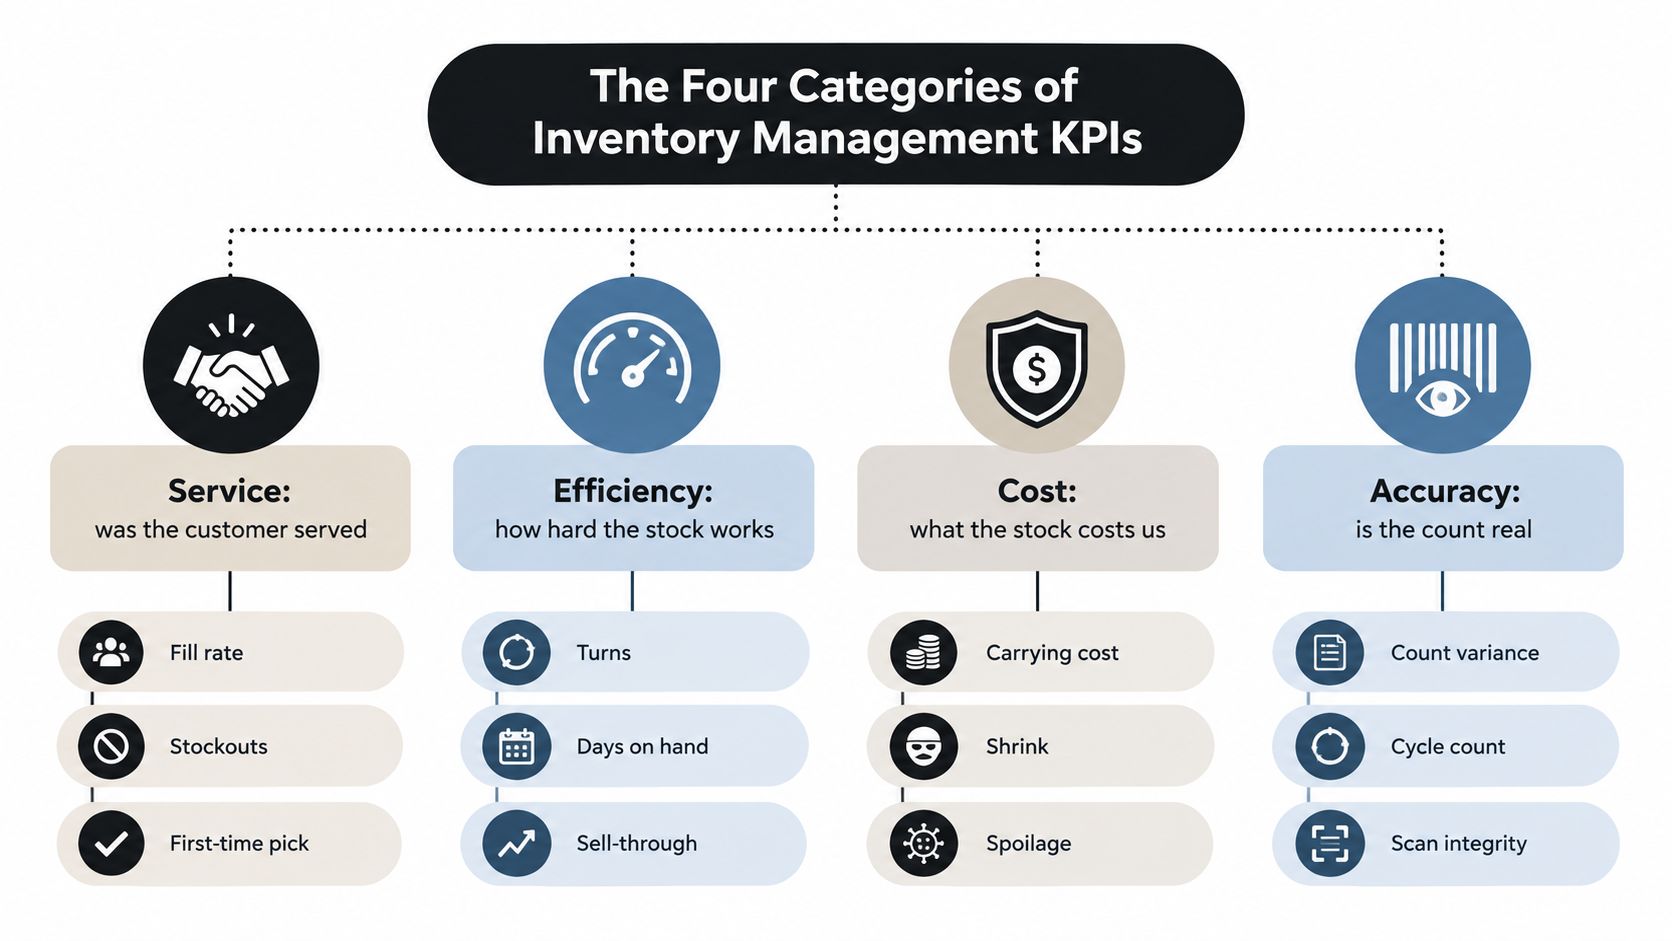
Operators should select one or two measures from each category rather than collecting several versions of the same signal. This balanced approach is consistent with guidance to use a small, governed KPI set, define formulas, assign benchmarks, and establish a review schedule through inventory management KPI guidance from NetSuite.
The same principle applies to systems selection. Businesses comparing platforms can use how Doczen supports supply chain optimization as a useful reference point for thinking about visibility, automation, and exception handling. For vending operations, the test is simple: does the tool help someone decide which machine, SKU, or route needs attention? Practical examples of operational efficiency metrics can help connect the scorecard to daily work.
Stockout Rate
Stockout rate measures the share of demand that couldn't be fulfilled because a requested SKU was unavailable. A useful vending formula is:
Stockout rate = stockout events ÷ total demand events × 100
Telemetry should define demand through vend attempts or recorded product requests, not through what a driver happened to load onto the truck. If a machine runs empty overnight and gets replenished in the morning, the customer still encountered a stockout. The event belongs in the machine's service record.
A commonly cited retail benchmark places general merchandise stockout performance below 3%, while core fast-moving consumer-goods lines are commonly benchmarked below 1%, as documented by Growsights' retail inventory KPI guidance. Vending operators should use those figures as context rather than blindly copying a retail target. A workplace machine has different visit patterns, assortment depth, and demand peaks.
Tier | Stockout Rate | Status | Typical Action |
|---|---|---|---|
Core fast-moving line | Below 1% | Strong availability | Preserve the current par level and monitor demand changes |
General merchandise context | Below 3% | Acceptable reference range | Review recurring SKU and machine-level exceptions |
Above reference threshold | Above 3% | Service risk | Recheck thresholds, visits, missed replenishment, and assortment |
When the rate rises, check the affected SKU's par level first. Then review its sell-through curve, confirm that the last route visit completed correctly, and look for a demand spike at that location. A temporary increase in the machine's planned stock may help, but only after the operator confirms that the problem is demand rather than a missed scan or inaccurate count.
Stockout rate and fill rate are related, but they aren't interchangeable. One measures lost availability at the point of demand. The other measures how effectively a replenishment visit restores planned stock.
Fill Rate
Fill rate asks a route question: when the driver arrives, how much of the expected assortment is fulfilled? A general formula is:
Fill rate = units fulfilled ÷ units ordered or demanded × 100
A route can show a strong aggregate fill rate while still failing the products customers buy most often. For example, slow-moving items may occupy every planned slot while the leading cold drink positions remain empty. The average looks healthy, but the machine's commercial performance is weak.
Scenario | Slots Fulfilled | Slots Ordered | Fill Rate | What It Tells You |
|---|---|---|---|---|
Complete replenishment | All expected slots | All planned slots | Full planned fill | The visit restored the intended assortment |
Partial replenishment | Most expected slots | All planned slots | Incomplete fill | Check vehicle stock, picking, and route preparation |
Misallocated replenishment | Slow sellers filled | Fast sellers planned but unavailable | Aggregate result may look acceptable | The machine needs velocity-level analysis |
Repeated partial visit | The same slots missed repeatedly | The same plan each visit | Persistent underfill | Review pre-kitting, par levels, and route discipline |
Fill rate should also be read against stockout rate. A low stockout rate with a low fill rate may indicate that the machine carries enough safety stock despite inefficient visits. A high fill rate with a high stockout rate may mean the operator restores stock well but visits too late.
The most useful action isn't padding every machine. It is identifying which slots earn their space, which products need more frequent replenishment, and which slow movers should be replaced.
Inventory Turnover
Inventory turnover measures how many times average inventory is sold and replaced during a period. The standard value-based formula is:
Inventory turnover = cost of goods sold ÷ average inventory
Operators can also use a unit-based version:
Inventory turnover = units sold ÷ average units on hand
The ratio is useful because it connects sales velocity with the stock tied up in machines, staging areas, and vehicles. A high ratio can indicate strong movement and lean holding. A low ratio may signal weak demand, over-assortment, or products occupying slots without earning replenishment attention. Neither result should be judged alone, because very fast movement can also indicate that a machine is repeatedly running empty.
Published references place overall retail turnover around 2 to 4 times, while public consumer-product companies often turn inventory around 5 to 9 times annually. Category figures vary materially, with apparel around 5.2x, furniture and home around 5.5x, consumer electronics around 7.3x, and household products around 8.7x, according to inventory turnover benchmarks by industry from Onramp Funds.
Category | Published Reference | Below-Target Signal | Above-Target Signal |
|---|---|---|---|
Overall retail | 2 to 4x | Stock may be sitting too long | Check for availability risk |
Public consumer products | 5 to 9x | Review demand and assortment | Confirm stockouts aren't hidden |
Apparel | Around 5.2x | Slow movement or excess depth | Potential replenishment pressure |
Furniture and home | Around 5.5x | Capital tied up in stock | Validate availability |
Consumer electronics | Around 7.3x | Weak sell-through | Check for empty high-demand positions |
Household products | Around 8.7x | Excess or weak demand | Check whether safety stock is too lean |
For vending, slice turnover by machine, route, and category. A snack machine and a coffee station have different demand rhythms, so one route-wide average can conceal a poor assortment decision. Use the ratio to decide where to reduce depth, where to change products, and where to increase visit attention.
Days on Hand
Days on hand translates inventory movement into a question drivers can answer quickly: how long will the current stock last at the present sell-through rate?
Days on hand = average inventory ÷ average daily usage
It works as inventory turnover's practical companion. Turnover describes repeated movement over a period, while days on hand describes the remaining supply window. A low figure can indicate efficient movement, but it can also warn that a fast seller will empty before the next visit. A high figure may protect service, or it may reveal a slow item that has been overfilled.
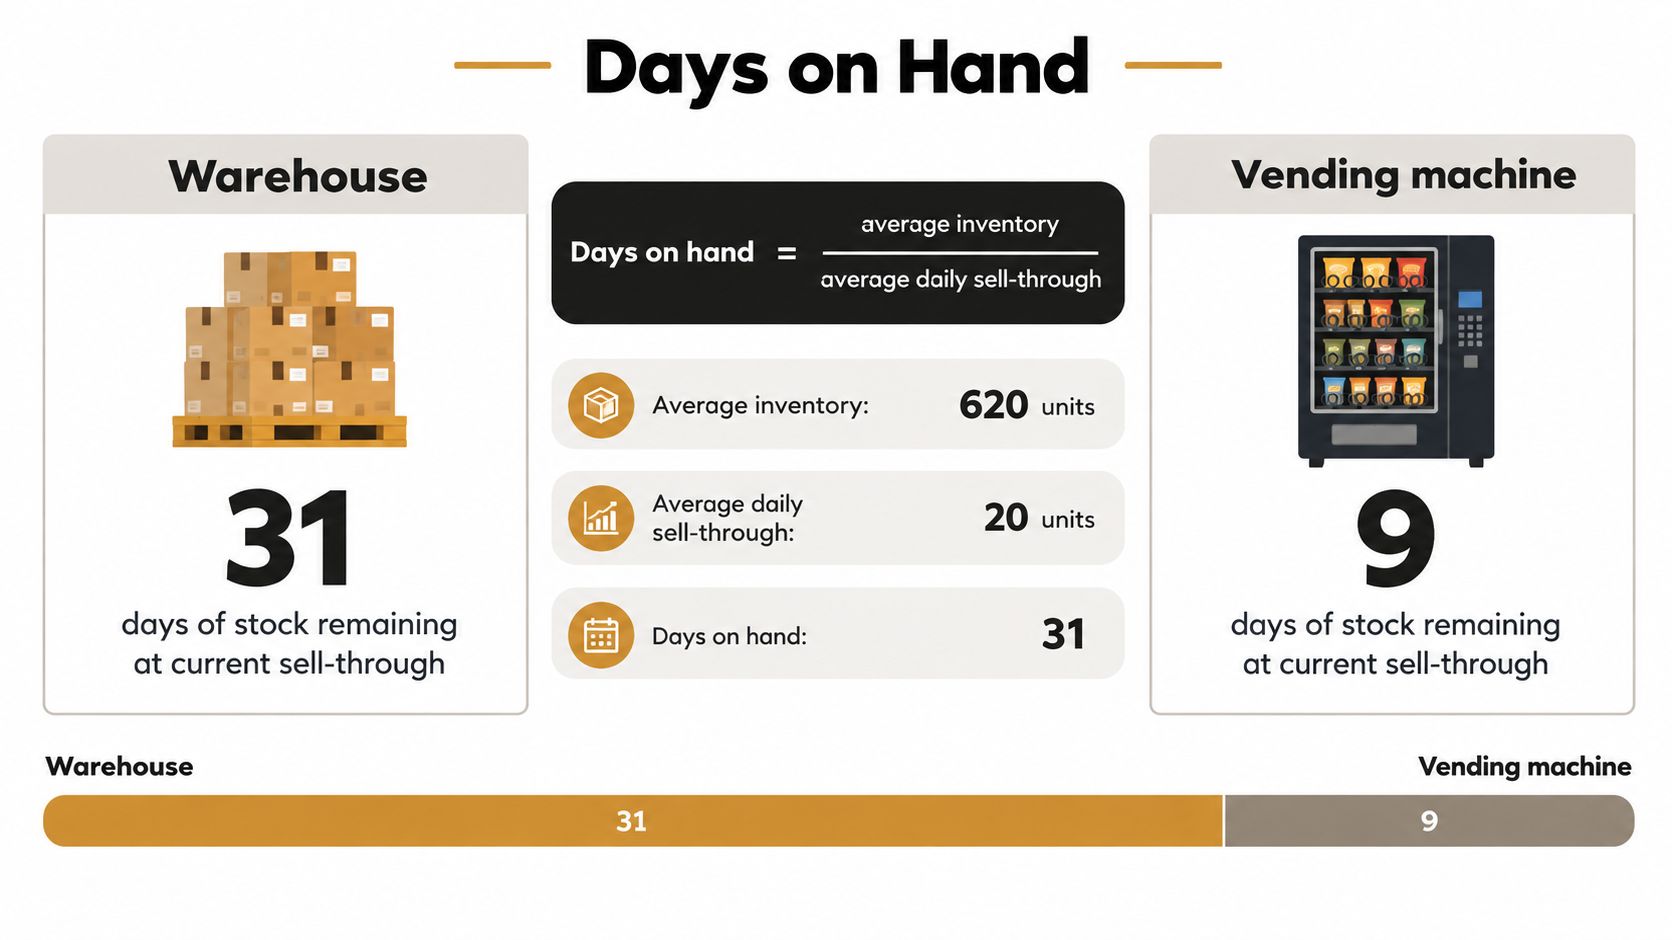
Don't average every SKU together. Segment days on hand by velocity tier, machine, and product type. A top-selling bottled drink with a short supply window deserves a different response from a slow snack with a long supply window, even if both contribute equally to the machine's average.
A days-on-hand figure is a planning signal, not a verdict. Pair it with stockout rate and turnover before changing a par level.
The calculation also depends on trustworthy counts. If the system says a machine has more units than it physically holds, days on hand will look safer than it is. That is why operators should investigate accuracy exceptions before treating a low or high result as a demand problem.
Shrinkage and Spoilage
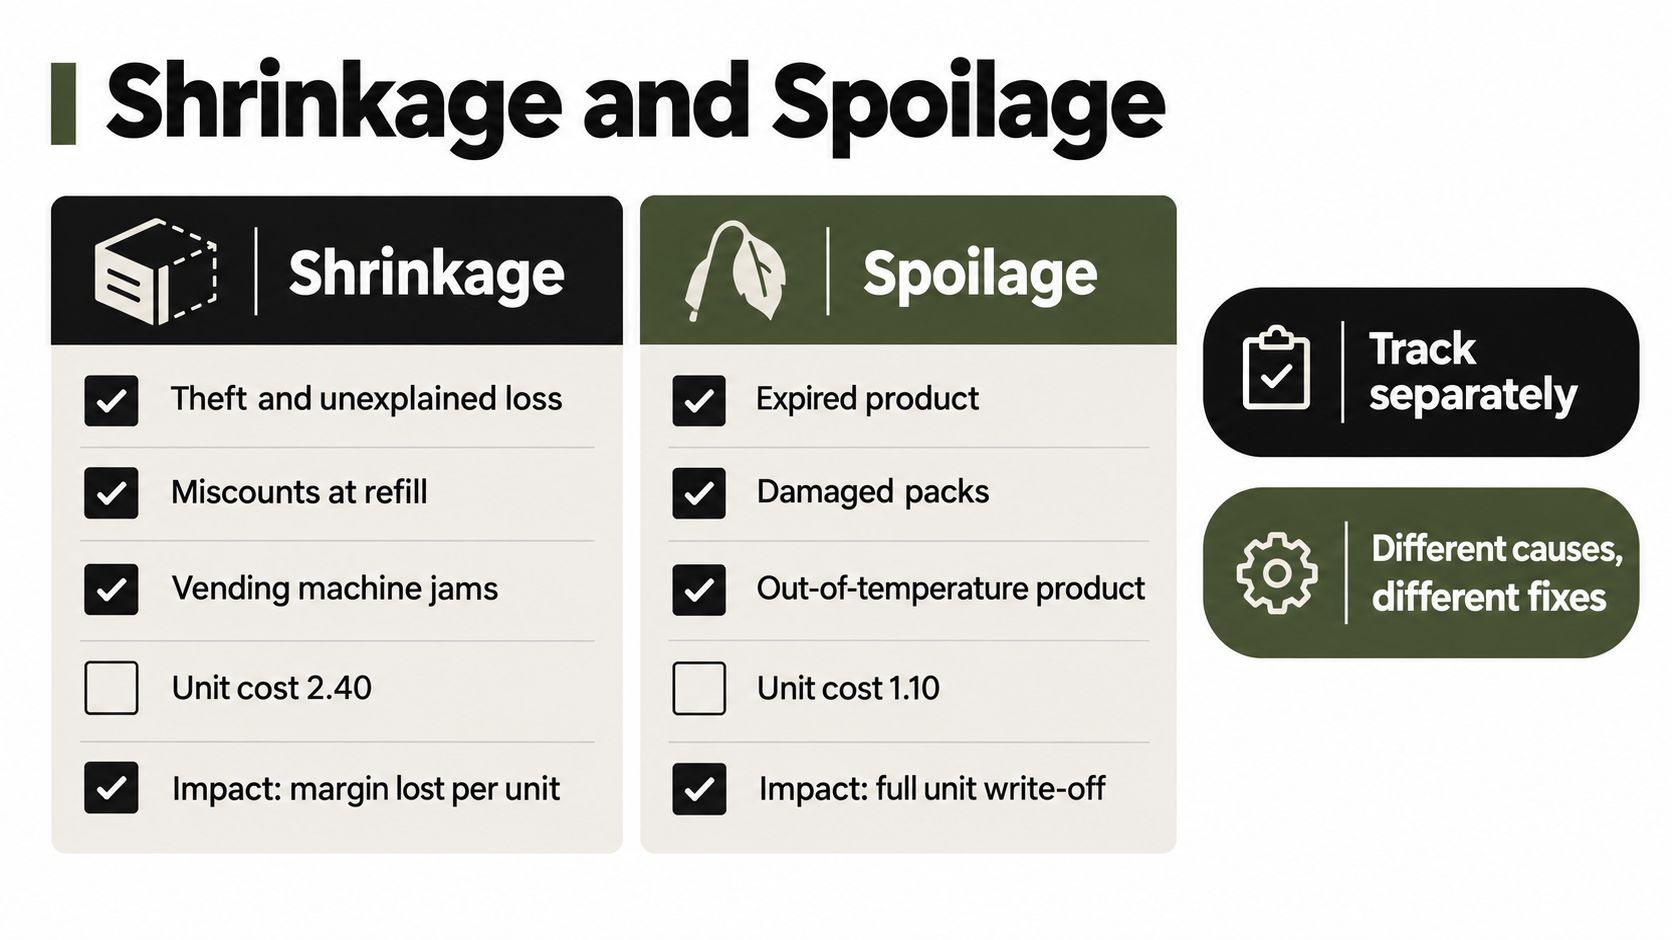
Shrinkage and spoilage are separate cost KPIs. Shrinkage is inventory that disappears through theft, miscounts, jams, payment-related discrepancies, or other unexplained losses. Spoilage is product that becomes unsellable because it expires, gets damaged, or falls outside safe temperature conditions.
Vending creates specific failure points that warehouse dashboards often miss. A misvend can remove a unit from physical stock without creating the expected sale. A refrigeration fault can damage products while the inventory system still reports them as available. Fresh food also creates code-date pressure that ambient snacks don't face.
A practical loss-rate formula is:
Loss rate = units lost ÷ units handled × 100
Track shrinkage and spoilage separately because the corrective actions differ. Shrinkage calls for count reconciliation, jam investigation, payment review, or a machine audit. Spoilage calls for temperature checks, date rotation, assortment changes, and better handling.
Use a short weekly loss-detection routine:
Reconcile counts: Compare telemetry vend totals with the physical count after replenishment.
Review temperature records: Look for refrigeration exceptions before writing off chilled or frozen stock.
Record code-date pulls: Separate expired product from damaged product so the assortment can improve.
Escalate repeated variance: Flag any machine with recurring unexplained discrepancies for a physical audit.
A machine with repeated variance events shouldn't receive more inventory just because the system says it is low. Correct the record first, then decide whether the machine needs a different par level. Vendmoore's practical guidance on shrinkage prevention is relevant when operators are building that control routine.
Inventory Record Accuracy
Inventory record accuracy measures how closely the system record matches physical stock. When book inventory is above zero, a commonly used formula is:
Inventory accuracy = 100 × (1 − |book quantity − physical quantity| ÷ book quantity)
Accuracy is more than a bookkeeping measure. A wrong count changes the inputs behind stockout rate, fill rate, turnover, and days on hand. The dashboard may report available stock when the machine is empty, or recommend another case of a product that is already sitting in the back of the machine.
A 2025 NetSuite summary citing CAPS Research reported an average inventory accuracy rate of 83% in 2024, while only about 69% of companies tracked the KPI, highlighting the measurement gap described in NetSuite's inventory accuracy coverage. That context is especially important for connected vending, where automated recommendations can spread a small record error across repeated replenishment decisions.
SKU Class | Count Frequency | Tolerance Band | Owner |
|---|---|---|---|
Fast-moving products | Frequent cycle counts | Tight tolerance | Route supervisor |
High-value or sensitive products | Frequent physical verification | Tight tolerance | Operations lead |
Slow-moving products | Scheduled periodic counts | Defined operational tolerance | Merchandiser |
New or recently changed products | Count after assortment change | Confirm system and physical position | Implementation owner |
Use cycle counts instead of waiting for a large annual reconciliation. Fast movers deserve more attention because a small discrepancy can affect several replenishment decisions before anyone notices it. Slow products still need periodic checks, especially after a planogram change or machine service visit.
Planogram audits matter as well. A product in the wrong spiral, an unrecorded slot change, or a replacement SKU with the old barcode can make a machine appear inaccurate even when the physical count was performed correctly.
Telemetry-Driven KPI Reporting
Telemetry changes inventory management KPIs from historical spreadsheet summaries into live exception management. The route lead doesn't need to inspect every machine with equal intensity. The system should surface the location, SKU, or event that needs a decision.
Useful data sources include:
Sell-through events: Each vend updates demand and identifies velocity changes.
Pre-kit alerts: Low-stock signals help the team prepare the right products before departure.
Temperature and door logs: These expose conditions that can create spoilage without an obvious sales signal.
Cashless payment reconciliation: Payment records help compare expected transactions with recorded vends.
Restock scans and counts: These establish the expected post-visit inventory position.
Each KPI can then be recalculated around an operational event. Stockout rate can trigger when telemetry detects an empty slot or a failed vend attempt. Fill rate can compare the last-vend-to-replenish window with the planned refill. Shrinkage can be flagged when expected post-restock inventory doesn't match the counted position.
A layered cadence keeps the system useful:
Daily exception review: The route lead checks urgent machine, temperature, and stockout alerts in a brief stand-up or dispatch review.
Weekly SKU tuning: The merchandiser reviews velocity, repeated exceptions, and assortment changes.
Monthly leadership review: Operations compares the scorecard with service, cost, and route decisions.
Quarterly benchmark review: The team checks whether targets still reflect the operating model and customer mix.
The dashboard should answer three questions immediately: what changed, where did it happen, and who acts next? Guidance on telemetry data collection can help operators think through the data layer behind that workflow.
Setting SMART Targets and Review Cadence
A KPI target needs a definition, a time window, a data source, and an owner. SMART targets make the measure specific and time-bound instead of turning “improve availability” into a vague management request.
Assign the fastest review cycle to metrics that can lose sales quickly. Stockout rate, fill rate, and inventory accuracy deserve weekly exception review. Turnover, days on hand, shrinkage, and spoilage usually need a trend view because a single event shouldn't trigger a route redesign.
A simple operating model looks like this:
Route supervisor: Owns machine availability, stockout exceptions, and fill performance.
Merchandiser: Owns assortment, velocity tiers, and slow-moving product decisions.
Warehouse or staging lead: Owns pick accuracy, pre-kits, and load readiness.
Operations manager: Owns target governance and monthly trade-offs between service and cost.
Keep each functional dashboard to roughly 5 to 7 metrics, as recommended in NetSuite's inventory KPI guidance. The rule protects attention. Add a metric only when someone can explain what decision it improves.
A Monday review can stay short if it follows a fixed order: review exceptions, identify the affected machine or SKU, assign one action, set a due date, and close last week's actions. Link each target to a documented formula so the team doesn't argue about definitions instead of fixing service.
For a broader view of reporting discipline, operators can use performance reporting guidance from Vendmoore as a reference when building their own review process.
Quick-Reference KPI Scorecard
The scorecard below is designed for a dispatch room, route tablet, or onboarding document. It keeps the core inventory management KPIs visible without pretending that every warehouse metric belongs on a vending dashboard.
KPI | Formula | Benchmark | Data Source | Owner | Review Cadence |
|---|---|---|---|---|---|
Stockout Rate | Stockout events ÷ total demand events × 100 | General retail reference below 3%; core fast-moving lines below 1% | Vend attempts, empty-slot events, customer demand | Route supervisor | Weekly exceptions |
Fill Rate | Units fulfilled ÷ units ordered or demanded × 100 | Set by machine, route window, and assortment plan | Restock scans, planned quantities, telemetry | Route supervisor | Weekly exceptions |
Inventory Turnover | COGS ÷ average inventory, or units sold ÷ average units on hand | Retail context around 2 to 4x; public consumer products around 5 to 9x | Sales, product cost, physical and system inventory | Operations manager | Monthly trend |
Days on Hand | Average inventory ÷ average daily usage | Set by SKU velocity and route interval | On-hand counts and sell-through events | Merchandiser | Weekly for exceptions, monthly for trend |
Shrinkage | Unexplained units lost ÷ units handled × 100 | Establish a route baseline and investigate repeated variance | Vend reconciliation, physical counts, machine events | Operations lead | Weekly exceptions |
Spoilage | Spoiled units ÷ units handled × 100 | Establish separate ambient, chilled, and frozen baselines | Code-date pulls, temperature logs, write-offs | Merchandiser | Weekly exceptions, monthly trend |
Inventory Record Accuracy | 100 × (1 − absolute book-to-physical variance ÷ book quantity) | Define a documented tolerance by SKU class | Cycle counts, scans, planogram audits | Route supervisor | Weekly for fast movers |
The scorecard should trigger action rather than just display colour-coded numbers. A stockout exception can prompt a par-level review. A fill-rate exception can expose a pre-kit problem. A turnover change can lead to assortment testing, while a record-accuracy failure should pause automated replenishment decisions until the count is corrected.
The best scorecard is the one a route supervisor can read quickly and use immediately. It connects machine telemetry with physical discipline, customer availability, and cost control.
Vendmoore Enterprises provides smart vending services with cashless payments, connected inventory visibility, product assortment adjustments, and replenishment-focused support for workplaces and public spaces across Oklahoma. Visit Vendmoore Enterprises to discuss a managed break room vending program or a machine solution built around measurable service performance.
Comments