
Vendor Managed Inventory System: How It Works in Vending

The snack row is empty by 10am, and nobody in the building knows who's supposed to fix it. Someone messages the vending company, waits two days for a visit, and watches the same two rows sell out again the following week. Beside them, a column of drinks nobody wants sits untouched, holding space a better seller could use.
That gap between what a machine sells and what arrives on the truck is the whole problem a vendor managed inventory system solves. Not sensors for their own sake. Not a fancier payment terminal. The change is who decides when to restock, and what evidence that decision rests on.
This guide builds the idea in layers. First the everyday principle, then the data signals, the stock limits, the readiness tests, and the results worth expecting. I'll also show where these programs fall apart, because they tend to fail for boring reasons: stale counts, limits nobody reviewed, and alerts that sit unread for days.
What a Vendor Managed Inventory System Does
Start with a household image. A dairy delivers on a standing route and can see how fast your kitchen goes through milk. The driver notices you're taking two liters a day instead of one, so Thursday's crate is bigger and the carton never empties. Nobody writes a shopping list, because the party supplying the milk holds the replenishment decision.
A vendor managed inventory system runs on that same logic. The supplier, not the customer, decides when stock is replenished and how much to send. The customer's job shifts to two things: sharing consumption data, and agreeing the stock limits that govern the supplier's choices. In vending, the site gives the operator visibility into machine sales, the operator sets minimum and maximum levels per machine, and the operator takes over ordering and visit planning.
The decision transfer, not the data feed
Plenty of companies share inventory data and still place every order themselves. In a genuine managed program, replenishment decision authority moves to the supplier. That transfer, rather than the software, is the defining feature.
The practice has retail roots. Retailers in the early 1980s began asking suppliers to take responsibility for replenishment using the retailers' own sales and inventory data, and 1985 is widely cited as a milestone year, when Walmart and Procter & Gamble adopted the model, as a City University of New York research paper on VMI recounts. Suppliers got steadier production runs. Buyers cut administrative work and often trimmed inventory spending.
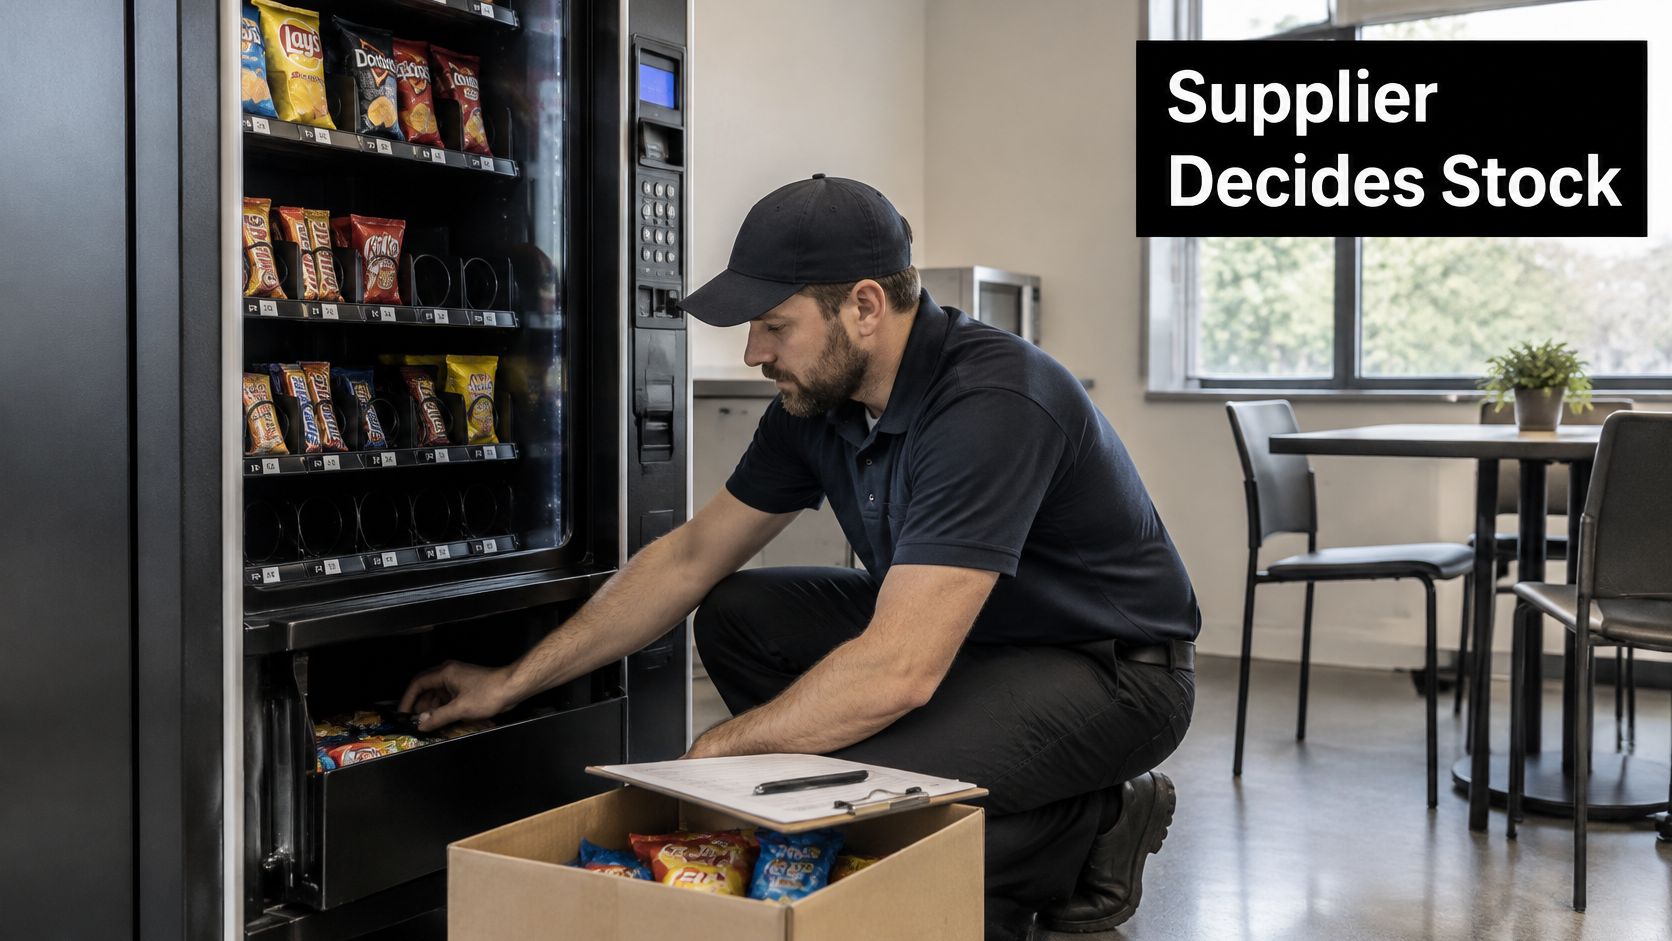
In vending, the principle lands on a much smaller stage. Each machine is a small inventory node with a limited set of selections, its own demand pattern, and a hard capacity limit on every column. Telemetry replaces the periodic manual count. The operator watches the sales data, sets limits per site, and decides what goes on the truck.
Adoption is still uneven. In 2024, 29% of more than 300 surveyed small and midsize businesses worldwide reported using vendor managed inventory, according to Netstock's 2024 Inventory Management Benchmark Report.
You can now do something practical with any vending arrangement put in front of you. Name the three parties and ask who holds the decision:
The site, which provides space and demand.
The operator, which owns the replenishment decision and the route.
The machine data, which supplies the evidence both sides argue from.
If the honest answer is "the driver follows a fixed schedule," that's a delivery service. It isn't managed inventory.
How the Replenishment Cycle Runs from Sale to Restock
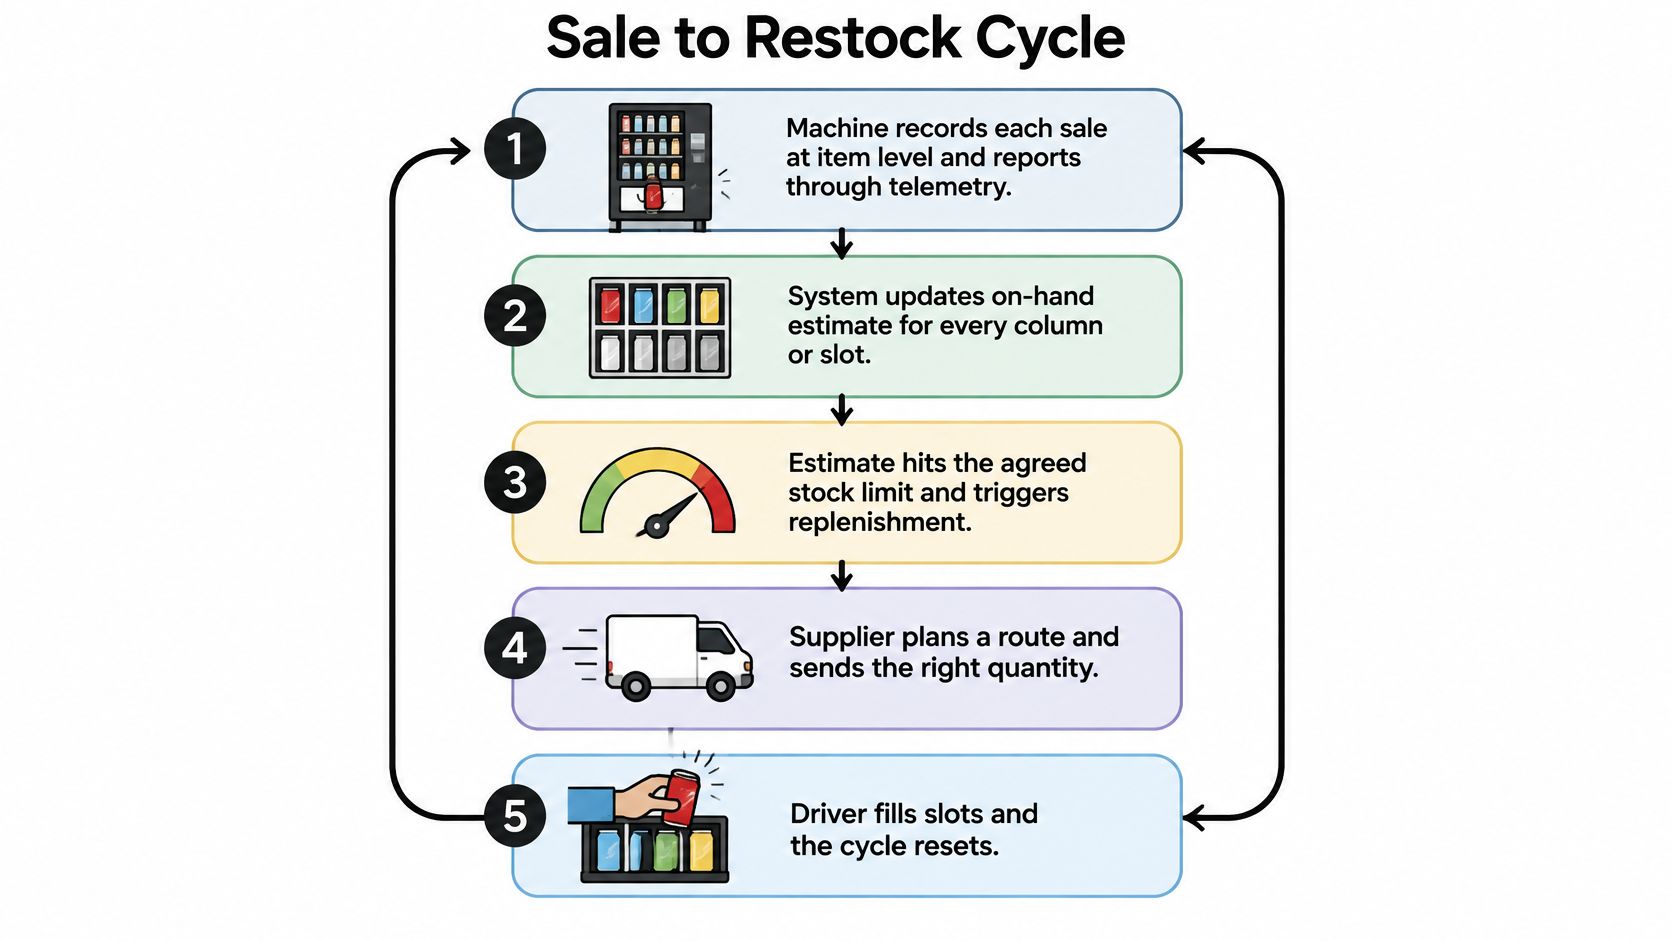
A bag of chips drops at 10:14 a.m. That sale starts a loop. The machine is a small inventory node with a fixed number of columns, and the loop decides the next visit from the count, not from a standing calendar. Sensors only report what left the machine. The operator still decides when to restock, using limits both sides agreed in advance. If those limits are wrong, or the count is dirty, the truck shows up with the wrong cases.
The cycle runs in seven steps. Each one exists because the step before it can be slightly wrong.
The machine records each sale at item level. Every vend logs the product, the column, and the time, and telemetry sends that record to the operator's system. Item-level detail is what separates replenishment from guesswork. A total units-sold figure says nothing about which slot to fill.
The system updates the on-hand estimate for every column. It starts from the last physical count, subtracts sales, and adds restock quantities. That estimate drifts when a vend fails to register or a product moves between columns, which is why step seven exists.
Replenishment logic compares each estimate with the agreed minimum and maximum for that machine. The limits are the contract in numbers. A minimum means the column should not fall below that line. A maximum means the column should not be filled past it.
When a limit is crossed, the system proposes an order quantity capped by machine capacity. It cannot send forty units of a snack that fits twelve in a column. Capacity capping turns a forecast into a pick list a driver can load, the way a grocery list stops at the space left in the fridge.
The route planner groups the machine into the next visit, exceptions first. Jams, door faults, and temperature problems jump the queue, because a broken machine sells nothing however full it looks. Geographic grouping keeps the rest of the route economical.
The technician restocks, records delivered quantities, and corrects gaps found on site. Real data re-enters the loop here. If the driver counts eight bags where the system expected twelve, that correction is the most useful input of the day.
The system reconciles the physical count with its estimate and adjusts the forecast. Reconciliation stops a small error from stacking. Skip it and a miscount hardens into a bias within a few weeks, so later orders chase a number the column never held.
Steps two, six, and seven carry more weight than the others, because everything between them depends on the count being roughly right. A delayed sales feed means the system is restocking yesterday's demand. A skipped count lets estimate error build until a column runs dry on a Friday afternoon.
A healthy cycle looks like this: the restock triggers before a column empties, the delivered quantity matches what the system proposed, and the reconciled count lands within a small tolerance of the estimate. Hold those three for several cycles and the data is trustworthy enough to automate against.
Operators who outgrow spreadsheets usually compare inventory automation tools to see how the same reconcile-and-trigger pattern behaves at larger scale, because the shape of the workflow matters more than the feature list.
The Data Signals That Drive Each Restock
Item-level sales drive every other decision, so start there. When a machine reports which product sold from which column and when, the operator gets a reorder quantity and a velocity estimate in one signal. Everything else either refines that signal or protects it from going stale.
Signal | What It Tells the Operator | Replenishment Use | Alert Trigger |
|---|---|---|---|
Item-level sales | Which products move and how fast | Sets reorder quantities | Sales stop for a full cycle |
On-hand estimate | Units left in each column | Triggers restocking | Below the agreed minimum |
Machine capacity | Slots and cases available | Caps order size | Slots full or empty |
Delivery timing | When the last visit happened | Plans the next route stop | Visit overdue |
Exception alert | Jam, open door or temperature fault | Prioritises urgent visits | Any fault raised |
Expiration date | Shelf-life risk per product | Prevents spoilage losses | Within the set days of expiry |
Capacity caps the order. Delivery timing sets the route. Exceptions reorder the day's priorities. Expiration dates stop a slow seller from turning into a write-off, which matters most in chilled and frozen equipment where shelf life is short and the cost of a miss is high.
These signals need to arrive close to real time. A feed that lands three days late describes demand the site has already moved past. Our telemetry data collection explains how machines report this detail continuously rather than in scheduled batches.
To judge the sales signal product by product, learn to calculate sell thru rate for each item and compare it against the restock interval, not against the machine's total volume.
The tests that follow show how to check whether these signals are reliable enough to act on.
Setting Stock Limits for Each Vending Location
One inventory policy for every site is the most common design mistake in managed vending. A machine in a busy office tower and a machine in a teacher lounge see completely different demand, and identical rules will overfill one while starving the other.
Policy | How It Sets Stock | Best For | Main Weakness |
|---|---|---|---|
Fixed par level | Same stock on every visit | Stable single site | Ignores demand swings |
Adaptive min/max limits | Limits set per machine from its sales | Mixed-demand sites | Needs clean sales data |
Tiered by machine class | Limits set per class such as office or school | Operators running many sites | Needs careful classification |
The same policy, two very different rooms
Consider a 40-select machine with two chill zones in a busy office break room. Demand spreads across beverages, snacks, and chilled food, the room is occupied five days a week, and an empty row gets noticed before mid-morning. That site can justify tighter review cycles and a higher availability target.
A low-volume machine in a teacher lounge needs the reverse. Teacher lounges, apartment community areas, and office breakrooms all get break room vending from us, and each carries a different demand curve. On a quiet site, lower targets keep slow-moving products from occupying chilled capacity for a month while a better seller waits.
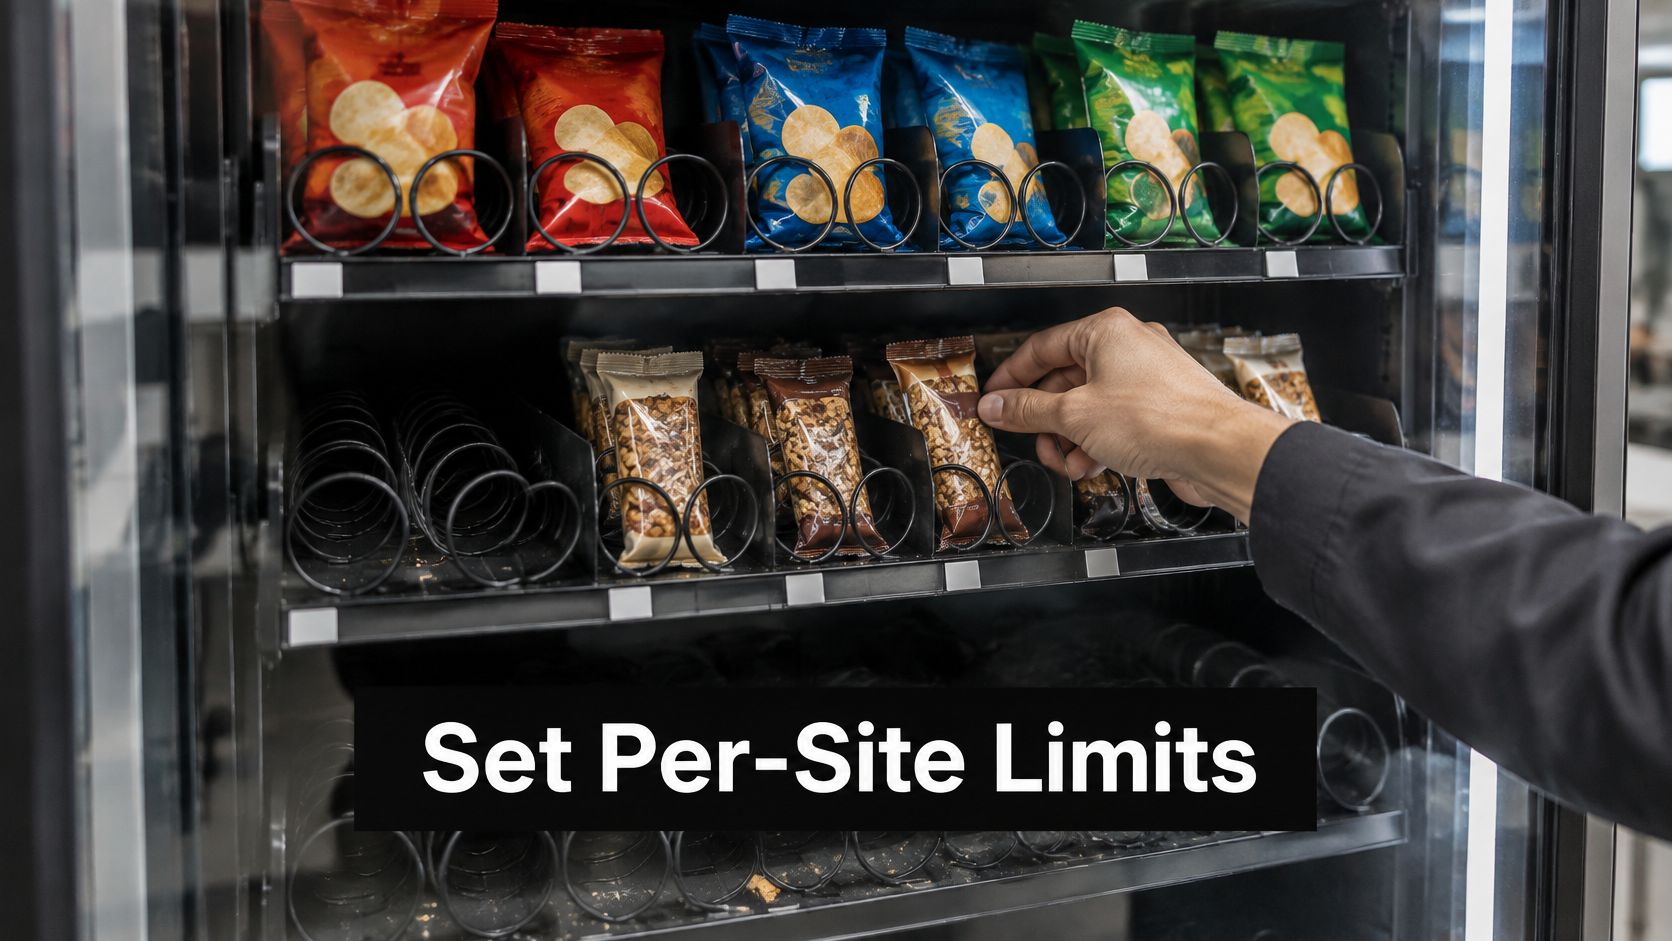
Choosing between the three policies comes down to how much you know. Fixed par suits a single site whose demand barely moves. Tiered classes suit an operator running dozens of similar buildings. Adaptive limits suit anything with real variation, provided the sales data is clean. And because a minimum level is really a buffer against demand swings, it pays to work out your buffer inventory deliberately rather than copying a number from another site.
What to watch as limits age
Six numbers tell you whether the limits still fit: forecast error, demand intermittency, replenishment lead time, compartment capacity, expiration risk, and service-level attainment. A machine that starts running out of the same row every Tuesday is telling you the minimum is too low for that column, not that the driver is slow.
Machine capacity sets the ceiling on all of it. Reviewing vending machine capacity per column before you raise a maximum prevents an order quantity that physically won't fit.
The setup sequence is short. Classify each location by demand profile, set limits for its class, review those limits quarterly, and move a machine to adaptive limits once its sales history has stabilised.
Practical rule: We customize each machine's inventory to fit the needs of the space where it's placed. Classification comes first, limits second, automation third.
Readiness Checks Before a VMI Programme Starts
A plain fixed-route setup with accurate counts and fast replenishment beats a platform fed with delayed or inaccurate data. That's the uncomfortable part of VMI adoption, and it's the part sales pitches skip.
The evidence is conditional, not universal. A 2025 analytical study of when VMI improves outcomes found that VMI reduces both inventory and stockouts only when it improves ordering efficiency or shortens replenishment lead times. Handing replenishment to a supplier and changing nothing else isn't enough. The same analysis points to information quality, timely data sharing, joint planning, relationship quality, and resource sharing as the contributors that decide whether a program holds. It also cites a healthcare inventory case where recorded accuracy climbed from 93.19% to 100% after VMI, with the caveat that recorded demand and physical stock have to reflect reality for the calculations to work.
Check | Ready Signal | Warning Sign |
|---|---|---|
Physical count accuracy | Count matches the system within a set tolerance | Frequent gaps found on visits |
Sales data latency | Sales reach the system the same day | Sales arrive days late |
Lead-time variability | Restock arrives on a predictable schedule | Visits slip by days |
Min/max discipline | Limits reviewed each quarter | Limits set once and forgotten |
Exception handling | Alerts assigned to a named person | Alerts left open for days |
Demand-spike response | Event or holiday restock plan agreed | Stockouts after peak periods |
Why distributed sites are harder
Offices, schools, hospitals, factories, and public venues break forecasting in a specific way: demand shifts by shift, season, event, and occupancy. A hospital machine empties on a night-shift pattern. A school machine is dormant for two weeks and frantic on the first day back. A factory line talks about a maintenance shutdown, not a promotion calendar.
Run the six checks in an afternoon per site. Walk the machine, compare the physical count against the system, and look at the timestamp on the last sales record.
Score it and count how many checks show a ready signal. Treat any warning sign on count accuracy or sales latency as a stop sign, because automation amplifies bad data rather than correcting it. Gaps between recorded and physical stock are worth chasing down before a pilot, not after, and the common causes are set out in this guide to inventory discrepancies.
What Results to Expect and When They Appear
A breakroom machine can sell out of iced coffee on Tuesday and still hold a full column of chips on Friday. A sensor can report both facts the same afternoon. What changes the result is who is allowed to decide the restock, and whether the sales counts and column limits are clean enough to act on.
Treat each machine as a small inventory node, closer to one warehouse bin than to a whole warehouse. The sensor is the clipboard on that bin. Supplier-led replenishment hands the reorder decision to the party watching many bins at once. That handoff, not the sensor by itself, is what a measured program is testing. Anyone promising a fixed outcome should be asked what has to be true for it to land. Gains show up when consumption data is accurate, stock limits are agreed, and someone follows them.
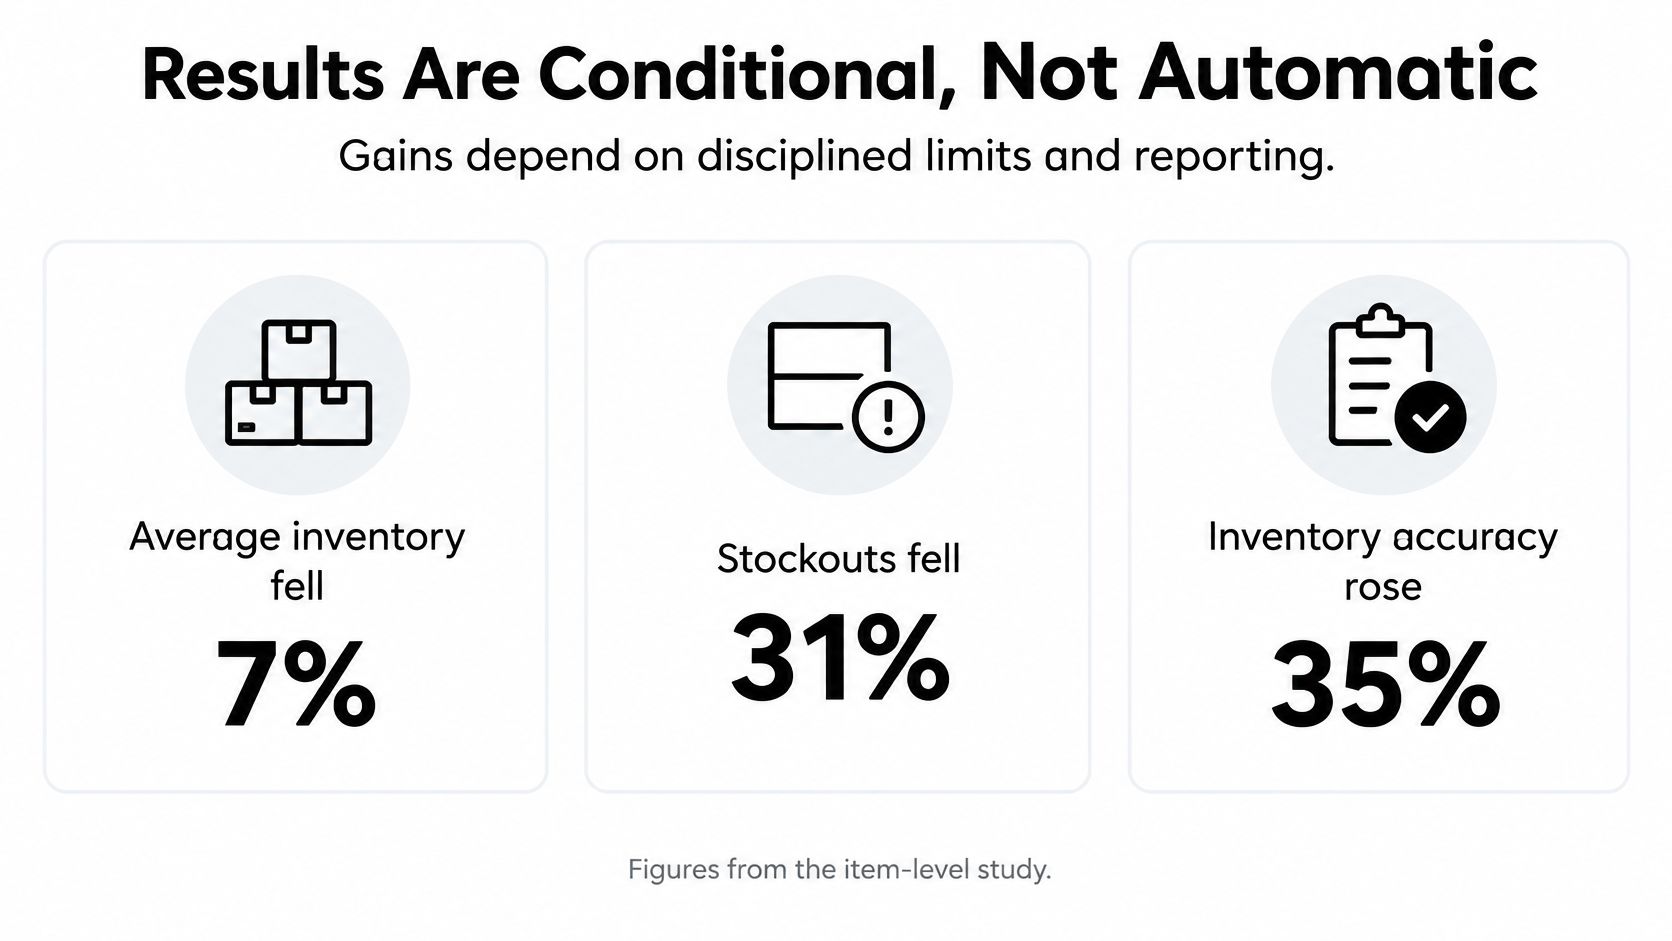
An item-level empirical study found that the decision-transfer part of VMI delivered benefits beyond simple information sharing: average inventory fell by 7%, stockouts fell by 31%, and inventory variability declined by 9%, as reported in the 2014 study on VMI decision transfer. Timing splits those totals. Inventory reductions tended to appear early. Stockout reductions were more likely to show after the first year.
Why the first month misleads
Four weeks mostly records the clearing of excess, not a finished service result. Early movement looks like less product sitting in slow columns, fewer emergency runs, and a smoother visit rhythm. Availability can look almost unchanged while overstock drains. A site that seems flat in month one may be working down what was already there.
The variability figure is the one multi-site operators should watch. Uneven demand normally leaves one location heavy and another empty in the same week, the way one classroom runs out of pencils while the next still has a full box. A 9% smaller swing in that pattern, from the same 2014 study, is worth more than the headline inventory cut, because it means fewer places are wrong at once.
Limits that match how each supplier behaves add a further slice. Research across 47 VMI suppliers at a large high-tech manufacturer found that classifying supplier types and tailoring inventory limits cut inventory cost by 4% to 6% without lowering service levels, and reported one case of roughly 7% lower inventory cost with only a 0.04% increase in stockout time.
On a vending route, that pattern reads as fewer panic visits, less money sitting in columns that barely sell, and steadier restocks across a mixed set of machines. Dirty counts or limits nobody agreed will not produce those numbers, no matter how often a sensor pings. Set the scorecard before the pilot starts. Track days of supply, inventory variance, stockout rate, and fill rate, and compare managed machines with a baseline across several replenishment cycles. How those four measures interact is set out in this overview of inventory management KPIs.
Choosing a Vending Provider and Pilot Terms
Two ownership models dominate, and they change what you're buying. In full-service vending, the provider owns the equipment and handles stocking, service, and support, so replenishment risk sits with them. In customer-owned machines, the site owns the hardware and the provider supplies replenishment and support, which gives more control over assortment and machine choice but leaves capital tied up in equipment.
Ask these before signing anything:
How fresh is the data? Ask how often sales reach the provider's system and whether you can see it.
What visibility do you get? On-hand estimates per column, not just a machine total.
Who owns the limits? Who reviews minimum and maximum levels, and on what cadence.
How fast are exceptions answered? A named person and a response window.
What do the pilot terms cover? Length, exit conditions, and which sites are included.
Oklahoma sites need the service area spelled out, not implied. Workplace vending in Oklahoma City, break room vending in Norman, office snack machines in Edmond, and vending for hospitals, schools, and manufacturing facilities are different jobs with different delivery realities, and a provider page should say plainly which ones it covers and how it staffs them. If you want to talk through data feeds, limits, or pilot terms, our line is open at 405-294-2373, Monday to Friday 9:00 AM to 5:00 PM and Saturday 9:00 AM to 3:00 PM.
Whatever the model, the terms that govern service are worth writing down rather than assuming. This breakdown of a vendor management service level agreement covers the clauses that get tested when a visit slips.
Decide Whether to Pilot a Managed Vending Program
Pilot when the readiness checks show mostly ready signals and the site has a clear service target it can be measured against. Don't pilot to find out whether the data is clean. Find that out first.
The pilot design is straightforward. Pick two or three locations with different demand profiles, record a baseline for several replenishment cycles, and review results at the end of each cycle rather than after a single month. The point of separating sites is to distinguish gains from better forecasting, which show up everywhere, from gains from more frequent visits, which show up at sites that got more deliveries but no better decisions.
Then keep it honest. Write down the current stockout rate, the sales-data delay, and the count accuracy for each site, compare those numbers against the readiness table, and only then ask for a quote and pilot terms.
Sites that fail more than a couple of checks should fix their data and limits first. Automation can't compensate for missing counts, and no platform rescues limits that nobody has revisited in two years. Vendmoore Enterprises offers full-service vending, where we handle stocking, service, and support, and sites that prefer to own their own machine can do that too. Call 405-294-2373 when you're ready to compare notes on your numbers.
Vendmoore Enterprises runs managed vending for workplaces and public spaces across Oklahoma City, Norman, Edmond, Moore, and the surrounding metro, with machines that report sales and inventory back to our team so replenishment is driven by data rather than a fixed route schedule. We tailor each machine's assortment to the space it sits in, whether that's a teacher lounge, a hospital corridor, a manufacturing break room, or an apartment community area. Visit Vendmoore Enterprises to check service availability for your address and talk through what a pilot would look like at your site.
Comments